

Building a Streamlit dashboard within a month
This is mostly for unveiling the dashboard and its functionalities, the technical insights can come later if there are interests...
The kitty is finally out of the bag…
I have been busy for the past month building a new Streamlit dashboard from scratch using what I have learned so far on my own journey and the lessons that I gathered from building the first two. Like most of my recent projects, I treat this dashboard as a one-off project which serves as a time capsule of what I was capable of doing at this point in time. The goal is simple, I want to have a project that I can look back on in 3 years time and cringe at how I have written the code or how I built certain functionalities.
Do I want to cater this project to people working in football and as a way to find opportunities? I would be lying if I say no, but having been through a lot with the industry this year, that is not one of my top priorities and it only plays a very small part. If there is any intention, then it is to show people working in football of the tools and dashboards that they can have and build, even with limited resources, because I built this dashboard on my own, with no paid tools used anywhere during my development process. It is somewhat an extention to the Tiny Tools, Tiny Teams article that I wrote a while back.

This dashboard was also meant to be part of a slightly different project that came with the article below that will now be stuck in the Draft Dungeon of Ideas That Will Never Be Executed. While some of the original functionalities stayed over to this new dashboard, the initial intention was very different and I had to repurpose both the repository and the idea for this new dashboard.
Without further rambling on about my own thoughts, I will leave you with the link to the app so you can have a play with it, the link to the GitHub repository for anyone who is interested to see how bad my code is, and an introduction to the functionalities of the app that I have written on my portfolio, if you are too lazy to move in between pages.
Overview
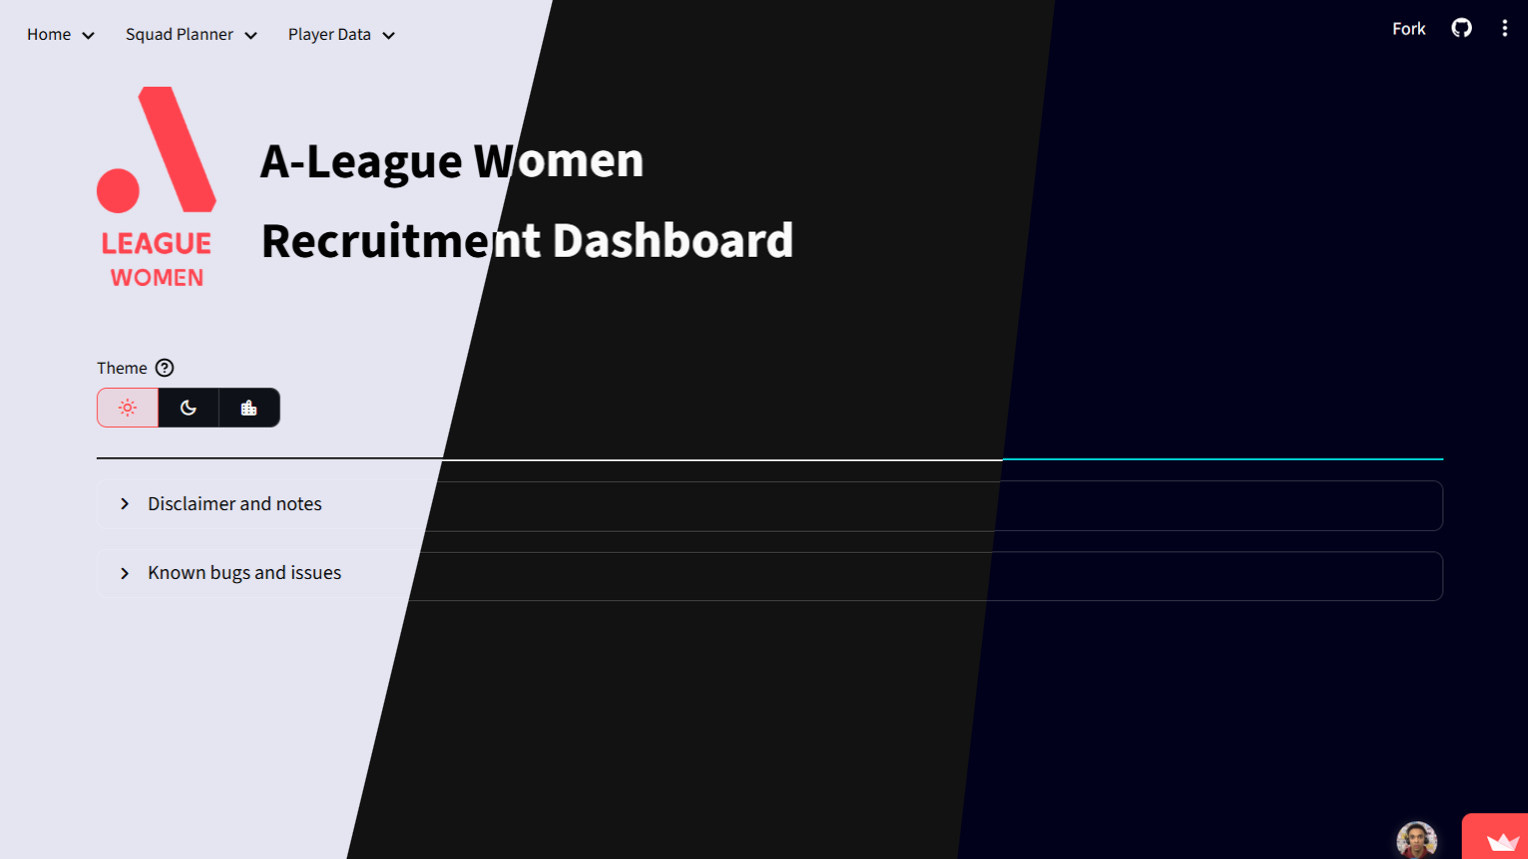
Having taken a fairly long break from working on football projects, I was inspired by the new A-League Women season that will kick off in late October 2025 (at the time of writing) and the league’s inclusion in the latest Football Manager installment. As a bid to learn more about the league, the clubs, and the players ahead of the new season, I returned to Streamlit with a new perspective and new knowledge learned to create a recruitment dashboard, inspired by Football Manager’s functionalities.
Functionalities
In a hypothetical world with a data-driven club, most of the decision-making process is driven by data, thus there is a need for the data to be available and accessible at key decision-makers’ fingertips. The dashboard addresses most of that concern, thanks to Streamlit Cloud’s infrastructure for hosting the dashboard and the data being stored on the cloud, allowing for immediate access and request from the dashboard.
Streamlit also supports responsiveness, which allows the dashboard to be viewed on-the-go and during important moments where data can be used to support and present to relevant stakeholders such as coaches, sporting directors, head of recruitment, etc.
The dashboard can also be used by the players, encouraging them to take more ownership of their data while also educating them on their own performance data that can be beneficial for their development and improvement on the pitch, which was inspired by Vosse de Boode’s approach for Ajax Amsterdam.
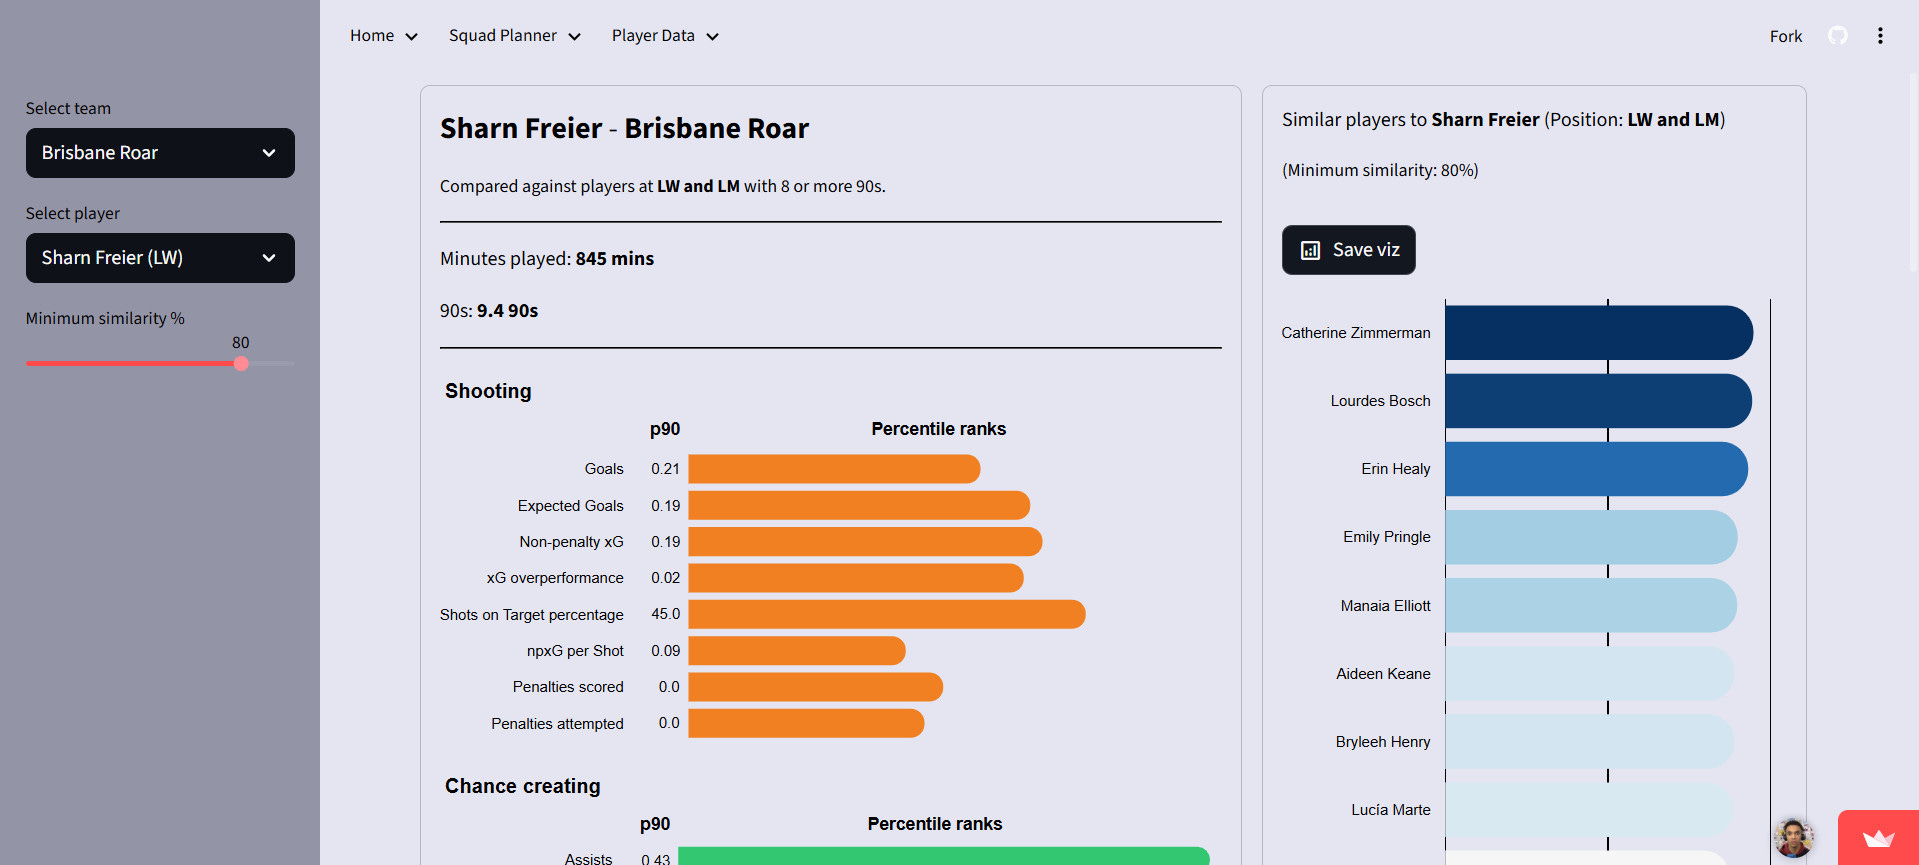
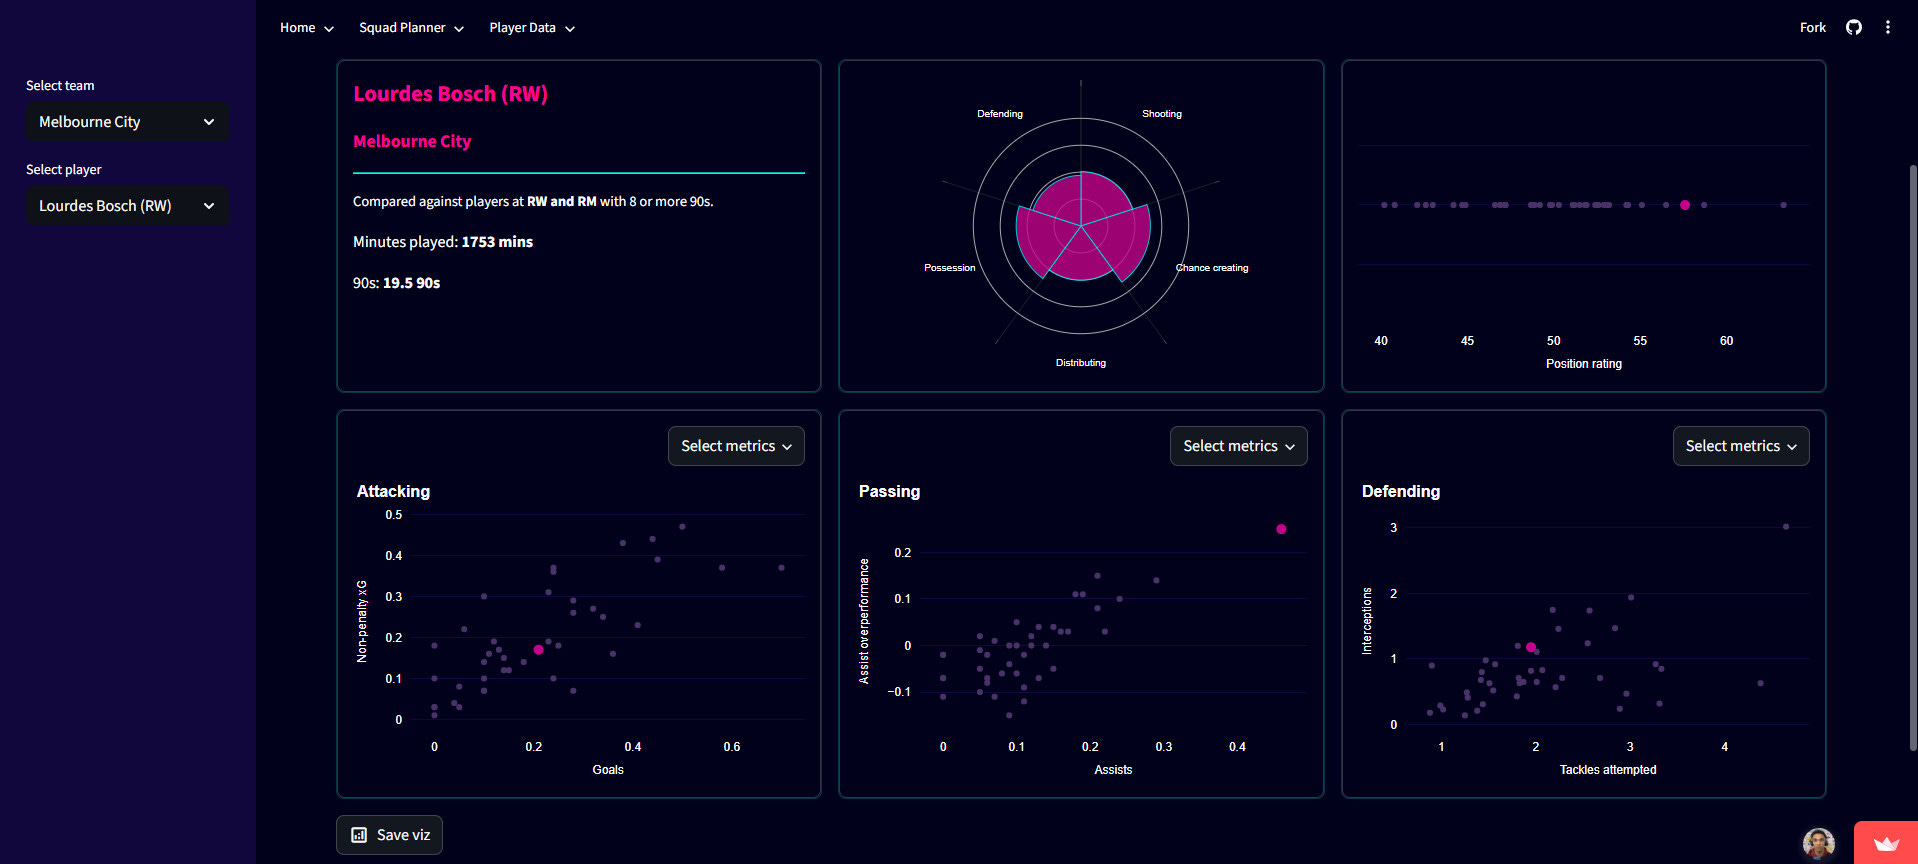
In contrast to previous Streamlit dashboards that I made, this dashboard prioritises visualisations interactivity, which makes the dashboard feels more modern and allows for more data to be viewed, in contrast to serving static Matplotlib visualisations on the front-end.
That does not mean Matplotlib visualisations are not used here, however, as the dashboard still allows the user to save visualisations created on the front-end by mirroring Plotly’s visualisations as closest as possible.
Limitations
Since this was meant to be a one-off project, there were features and functionalities that had to be left off due to time and resource limitation. However, I hope that the dashboard serves as a foundation for better ideas with more time and resources, either by football organisations or sport technology-focused companies.
Two things before I finish off this article:
Unfortunately the dashboard will not receive any further updates and supports heading into the new season. As much as I would love to do so, this was a solo project of mine and I had spent most of my free time over the past month to work on it while also balanced between a full-time job as well. I have decided for this project to be a one-off so I am not obsess over it and I want to have a bit of those free time back as some downtime and do my own things.
If anyone is interested in knowing more about the development process of the dashboard, like my thought process and why I chose to do certain things or wrote my code in a certain way, let me know in the comments and I will write a Dev Log edition specifically for this dashboard and explain everything!