

Dev Logs: Building a Streamlit dashboard (Part 1)
Give someone a report and it might answer a question or two. Give someone a dashboard and it will open up new perspectives.

Welcome to Dev Logs, an occasional series that will compliment any projects that I do! Here, I will talk less about the football side of things, but more programming and coding stuff, along with explaining my thought process behind some of the decisions that I made while working on the project. This is meant to be a bit more informal, because commenting in my codes is not enough to explain what I wanna achieve with certain features and code sections.
For this (maybe multi-part-er) Log, I want to dive into the intricacies of Streamlit and my own process of building dashboards. I have done a fair few dashboards, and you can find them all through the links below. After taking a step back from it for a couple of years, there are so many new things that I have learned about programming and Streamlit has also changed a lot during that time as well, so the way I approach a Streamlit project now is very different to how I approached it two years ago. And since I am building another dashboard for the 2024-25 A-League Women Team of the Season, which you can find the link to my work-in-progress repository here (link to the article and dashboard will be included in later parts, or when I’m finally finished), I thought “let’s document my thought process here and explain everything that I do”.
My previous dashboards and link to its code repository on Github:
Vietnam national team dashboard (for the 2022 World Cup Asian Qualifiers & 2020 AFF Cup)
Version 1 (which was quite dirty and unorganised)
A bit more detailed write-up about the project
Version 2 (which I have reworked for Snowflake integration, more about this later; this version has no public demo due to the expiry of my Snowflake trial account, but I have added a video demo in the repo)
Even more detailed write-up about version 2!
Olympic FC data dashboard (for the first club that I worked with, this dashboard was used for the 2022 season only; some features are broken cause they are time-reliant and I have not had the time to fix them)
Why a dashboard, and why Streamlit?
For the first question, I always refer back to this quote by An Nguyen from the American Soccer Insights summit in early 2025 (which I have done a write-up for the summit!, also so many links that I have embedded this early on into the Log, sorry!). Having worked as a data scientist and seen how things worked in an organisation, I still agree with this quote all day, every day, and twice on Sundays.

When you give someone a static Excel report with a bunch of data, you might be able to answer the question that they ask you, and maybe a couple more. But because the nature of an Excel report is to be quite static, there are not a lot of rooms for data exploration. Yes, you can also build a dashboard on Excel as well, which there have been countless tutorials on how to do them. But when you already know how to code, it is easier and more efficient to build a web-based interactive dashboard because it has more rooms to scale up and takes less time to build, and also easier to maintain too.
Which leads me to the next question, why Streamlit when there are other alternatives like Tableau, ShinyApps, etc. out there? This is quite easy to answer really, because Streamlit works well with Python and it was the first language that I started my programming uni course with. ShinyApps now works with Python as well, which provides another option to choose from. I have also been learning R so I might give Shiny a try at some point, and to take this to another extreme, I have been working as a freelance web developer on a TypeScript/React project, so I might also test myself and build a dashboard using TypeScript in the near future as well.
But, if I am looking to build a dashboard that is not just for me, but also for others to work on and maintain as well, Python and Streamlit seem to be the best combo option. Python is an easy language to learn and I assume most people who have coding knowledge will not have a tough time with it. R is a bit niche and is mainly used by the data science community, which also works if you are building a dashboard for data scientists or analysts. Using TypeScript and React is being a masochist, I will be honest, even though TS and JS are also not that hard to learn. It is probably the worst option in terms of maintenance if the team/people that you are working with have little to no knowledge of web developing. But if they do, it is definitely worth giving it a try, although, finding a good visualisation package to create specialised vizzes (like football/soccer vizzes) can be a tough task. Don’t ask me how I know that.
So this Log will be covering Streamlit, but I am tempted to create one in TypeScript and React to test my skills, which I might cover in a future Log.
The data
I will be using solely publicly-available data from FBRef and Fotmob. They both source their data from Opta anyway so there should be a coherent level here. I am aware that there are ways that I can scrape raw data files, like the Json ones that I used for the previous two dashboards. But unless there are anything very specific that are not publicly available, and I need that for my calculation or role measuring, it does not make sense to constantly ping Opta’s API for that one file.
I am also aware that scraping data is, technically, illegal. It is someone (a company)’s property and they are within their rights to put those properties behind a paywall to make money from it. That’s basically similar to you walking into a shop, stealing a bunch of stuff, then walk out and say ‘I stole these things for my own use’. That’s still illegal, so I prefer to stick with anything that are publicly available to not get into that grey spot.
I have also been slightly vocal on Bluesky when FBRef removed the advanced data for the A-League Women, and there is a good reason for that really. There are a lot of coverage and data analysis about the men’s leagues, even from my own blog, but there is not as much coverage, especially data analysis, for the women’s leagues. There are a few of publications/blogs who cover the English WSL and the American NWSL, including Catalina Bush and Chloe Sainsbury’s blogs. In terms of the A-League Women, that number goes down close to 0 because there might be a couple of data-focused blogs that I might not aware of. Other publications and blogs that I know mainly cover the news side of things, so I won’t count them here.
Because FBRef has reinstated the data for the league, I have been slightly vocal about its disappearance earlier this year, and I might be the very few who use that data, I might as well put it into good use and give it the justice and attention that it deserves. I have written an article using the data, which you can check it out below (another link, smh), but I want to do something a bit bigger if I only come back to this dataset every now and then.

Okay, that’s the good part about the data. Now to the bad parts.
First obvious problem: Like every FBRef datasets out there in the wild, the players’ positions are generally categorised. Basically, all players who have played as a centre-back, left-back, and right-back go under ‘DF’. All defensive, central, and maybe attacking midfielders go under ‘MF’. And all strikers, and sometimes, wingers, go under ‘FW’. There are even sub-categories like ‘DF,FW’ for wing-backs, players who have played as full-back, wide midfielder, and winger, and for centre-backs who were sent up front to play as a makeshift striker, apparently? Overall, it’s a big mess.
Second not-so-obvious problem: The first problem leads very well into the second, which is to answer the question ‘how do I know who plays in which position?’ Basically, if you give me the FBRef data of a player who is classified as a ‘DF’, how do I know if that player is a centre-back, a left-back, or a right-back? Luckily, the solution lies in FBRef’s match logs and cross-checking with Fotmob’s position data because their source is from Opta, so there (once again) should be an alignment.
But…here is where it gets tricky. For well-known players and players who have played regularly like Melbourne City’s Holly McNamara or Western United’s Chloe Berryhill, that’s an easy task. They both have started and played at a certain position more than other positions in FBRef’s match logs, and Fotmob have a dedicated player page showing their primary position. So I can just take their primary position and replace it in the CSV file.


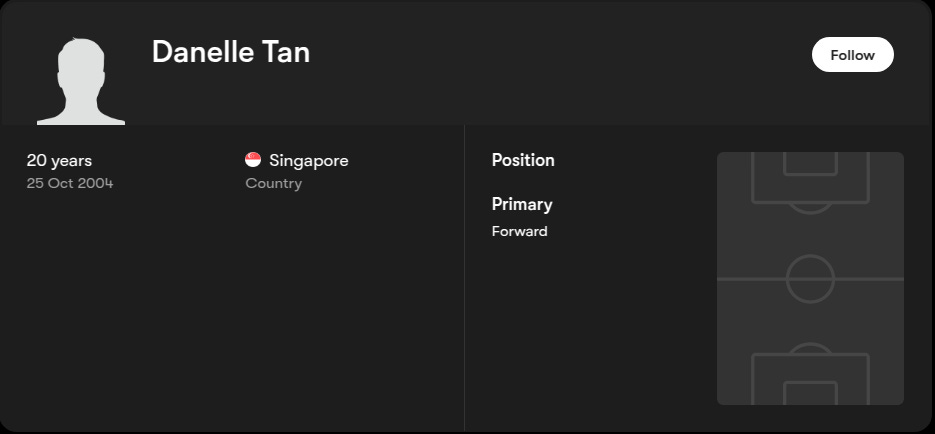
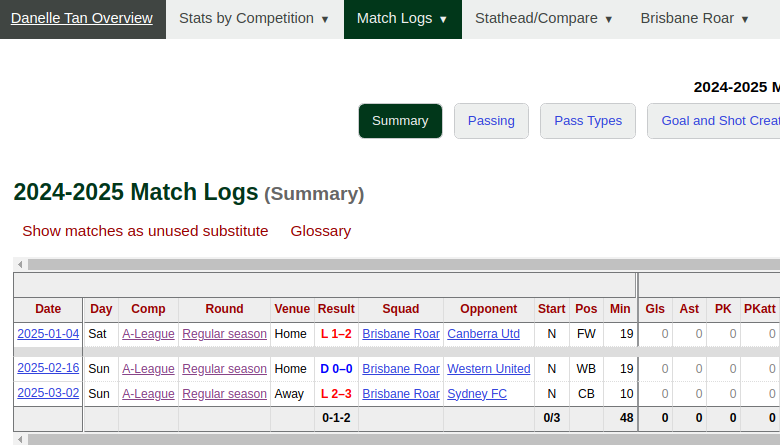
But what about players who have not played regularly this season and players who are not that well-known? Players like…hmm…Brisbane Roar’s Danelle Tan and Western Sydney Wanderers’ Milly Bennett? For Tan, this is where my own existing knowledge carries the weight…and using Soccerdonna’s help as well. I know that the Singaporean youngster is an out-and-out #9, and Soccerdonna confirms that, so that gives me a bit of confidence to say that Tan is a striker. These info are important when Tan’s Fotmob page is almost non-existent, her Fotmob match data are wildly mapped and cannot be accessed on the page, and FBRef’s match logs are unreliable due to the fact that Tan played almost equal minutes as a striker, wing-back (?), and centre-back (?).
For Bennett, it’s even worse. Notice how I did not leave a link to Bennett’s Fotmob page above…because there is none, even when searching with her full name ‘Amelia Bennett’! You cannot access her page from the matches that she played in, and you cannot even see her data from the match pages. This is also where my Dub (short way of calling the A-League Women, I also use ALW every now and then) knowledge fails me because I have not watched enough of the league to know where Bennett played most of the time.
Bennett’s Soccerdonna page suggests that she is a central midfielder, or ‘zentral mittelfeld’ if you are viewing the page in German, basically translate to the same term. But when you cross check that with FBRef’s match logs, which, thankfully, is a lot better and much more reliable, you can vaguely tell without doing the actual calculation that Bennett played the most minutes as a centre-back and only played a total of 112 minutes as a central midfielder. So, FBRef’s match logs conflicted with Soccerdonna’s suggested position, which means the suggested position is unreliable, but then it also leaves me with another question, “where is Bennett’s preferred position without asking the player herself?”


That is the biggest problem when dealing with data from the men’s lower leagues and women’s football data in general. There are so many holes and conflicting information between different sources, and, sometimes, there aren’t even any to begin with. Tan and Bennett are two examples that I can think of off the top of my mind, but there are definitely a few more players that gave me a hard time finding what their position for the 2024-25 season was. I think Adelaide United’s Abby Clarke is one of those players, her Fotmob page has no specific primary position (just ‘Midfielder’, yeah thanks for that!), her FBRef’s match logs are unreliable because Clarke played as a striker, left winger, and central midfielder, her Soccerdonna page has no suggested position. That left me with no choice but to look it up myself on Google and find any sources that can tell me, which there are almost none, by the way. In the end, I went with my gut and categorised Clarke as a central midfielder because she played the most minutes there.
This reminds me of Nancy Hensley’s talk from the 2024 Hudl Statsbomb Conference where she talked about both historical and current women’s football data being incomplete due to the lack of investment and interest in it. She also mentioned the fact that there are leagues who do not even have advanced data like the ALW, and I agree with that statement. I don’t have to go very far to find an example really, the NPL level of Australia (second tier-ish) is where most ALW clubs find new domestic and local talents for every season, yet the coverage for those state leagues is either minimal or non-existent. Another example is the Vietnamese women’s top division, where the entire women’s national team (one of the top 10 Asian women’s national teams by the way!) play in, and yet, the data coverage for the league is almost non-existent.
The whole point of me writing this article before the 2023 Women’s World Cup was to use more advanced data to highlight other players from within the team besides from Huỳnh Như. Samantha Lewis and the ABC team did an amazing data-focused article on all teams that participated in the tournament, but the one setback that they had was they did not have a lot of data about smaller national teams to work with. Vietnam was not an exemption, and to make the process easier, they went with Huỳnh Như as the team’s key player. It was not wrong, but I also did not feel right, because she was (and still is) the most well-known player in the team, so it felt like an easy choice to make. That’s why my article did not talk about Huỳnh Như a lot, but I chose to shift the spotlight to other players in the team instead.

Anyway, my point for the second problem is that never take working with a completed dataset for granted. It can be easy to work with data about the Premier League, La Liga, Bundesliga, or even the WSL and the NWSL. But if you are going to dive deeper into the world of football analytics, problems like these two (and the next one) will be a frequent occurrence when working with data from smaller leagues (and I don’t mean to say the ALW is a small league), and you have to find a way to navigate those problems if you want to achieve your goal.
Third teeny-tiny problem: It’s in the same vibe as the second problem, but it’s more of a problem because I am quite detail-oriented and I can’t stand having something that’s a bit off in my dataset. The thing that is a bit off to me is the alignment of player names; yes, it’s as simple as that.
I will go back to Abby Clarke and the sources that I used to cross check her playing positions. While FBRef lists her as ‘Abbey Clarke’, Fotmob, Soccerdonna, and the official source (which is Adelaide United’s website), lists her as ‘Abby Clarke’. I’m not sure how and why an ‘e’ got into Clarke’s first name on FBRef, but I can write that off as a typo by someone or a mistake in the code while pulling the data from Opta’s API.
But I cannot write off Milly Bennett though. Technically, her full name is Amelia Bennett, which is the name that many sources on Google use, including Soccerdonna, the Matildas’ website (which a page with her full name exists but with no records) and every time she was announced to be part of the youth national teams. The problem here is that even Western Sydney Wanderers’ official website uses ‘Milly Bennett’, which causes Opta’s data, and subsequently, Fotmob and FBRef to follow along. So, I have to align the names…somehow for the data to make sense? This is still something that can easily be fixed…
…until you reach a player where her name creates confusion for me. I won’t go into too much detail here due to confidential stuff and she is not in the ALW dataset, but she is just an example that I can think of right away. While working on a project for [redacted], I came across ‘Milly Broughton’ who plays for Arsenal/Spurs Women. When I wrote the code to (do something…), the code did not recognise that name, which triggered me to manually check. It turns out, her name is Milly Boughton, not Broughton, from everything that is on Google. The problem here is that the dataset that I had came from an internal source, so it was either a small typo or they knew something that the internet did not (which was highly unlikely). The confusion in me came from the fact that the dataset was from an internal source, so I cannot just make changes all by myself, while also knowing that Boughton’s name was spelt wrong. I think I did bring it up while talking to (someone…), but I don’t think that ever got resolved. It’s one of the occasions where I can’t trust the ‘trust me bro’ source because this is somewhat an official project for an organisation. When there are decisions being made based on the projects that I do, I have to do a lot of due diligence for it.
I originally wanted for this Log to be a single article, but the more I brainstorm and write about the project, the longer this article gets and it doesn’t make sense for me to squeeze in the entire development process, unless I want to write another >10k-word article, which I do not want to. So this will have to be it for the first part of this Dev Log, but I will return soon with part 2 where I kickstart the development process and talk about how I structure things and the initial idea that I have for the dashboard.
I hope this is something that is a bit different to what I usually write, which is the football stuff. I want to write more about the projects that I do and how do I get from a shower idea to a fully-sketched, functional idea. Hopefully this is interesting to some of you, and if it inspires you to go and do something fun and interesting, I’m glad and happy for you! But for now, that’s it from me!